
A Bar graph is a graphic diagram that is composed of colourful rectangular bars. This chart is normally used for the comparison of the main category that is on the horizontal (X) axis and its corresponding value or subclassifications on the vertical (Y) axis. Here are ways that a Bar Graph can be useful on different types of tasks:
1. for comparison of summarized Data
A bar chart is normally used if you have to make comparisons of the Data that you have compiled. The horizontal axis of the graph represents the category, and the vertical axis represents the value per category. Strategically, the bar chart will display a summarized representation of the whole topic that is to be discussed.
2. for illustration of subcategories of data
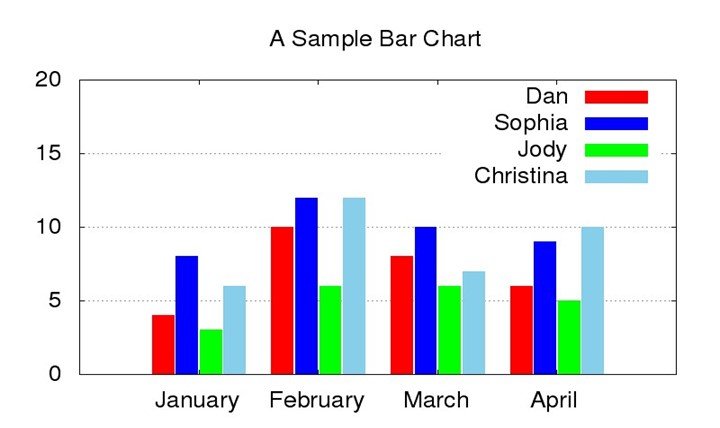
If you want to elaborate more and make subcategories, a bar chart is highly recommended. It can show an illustration of both the main classification and its sub-topic that could support the major one. Typically, it has a Key Legend wherein it indicates the discrepancy of the main category to its sub-classification.
3. for displaying the differences between the subcategories of data
It is useful in showing the difference between one subcategory to the other. Creating a bar graph is always the best option for this. For example, if you wanted to establish a summary comparison of the sales of your company for the last three years, this graph is highly recommended. By placing the bars of the same category on top of the other, you can emphasize the distinction of all the points that you wanted to highlight.
4. for illustration of both the main categories and the subcategories of data
There are times that you have to illustrate the different main categories, together with subcategories. But it must always be of a 100 percentile as a total. A bar chart is the most efficient tool to use for you to capture the whole illustration. With the help of the Key Legend, it is easier for you to explain the differences between your subcategories.
5. for time-based data collection
If you want to make a time sequel data collection, a bar graph is an appropriate choice. You can input either the year, month, or day that you wanted to outline as your major classification on the X-axis, you can enlist the corresponding subcategory that can support the Data on the Y-axis.
6. for comparing two main categories of data
When two different fundamental categories are being compared to one another, the efficient means of data entry is a bar chart. It can house the two main categories in the vertical axis and the subcategory on the horizontal axis. The chart can accentuate more of the data that you want to explain.
7. For an overview of the many data collected
If you wanted to make an overview of the several collected Data that are all under major classifications, making a bar graph is on the top of the list. Aligning all your main categories on the horizontal axis, you can disclose the data needed in the vertical axis.
8. for a quick description of Data
Sometimes you have a lengthy description of your major categories. Then you can use the aid of a double horizontal bar graph. Here, you can demonstrate both major issues in the horizontal axis. With the assistance of your Key Legend, you can bring out the precise data that can explain for itself.
9. It can display the results of the survey
Making survey results on paper can be done by a bar chart. Because in a bar graph, you can input a lot of different main categories in the horizontal axis and, at the same time, justify them with your subcategories in the vertical axis. Your Key Legend is also present to further clarify your vertical axis.
10. It displays mean, median and modal classes for Data
When you have to handle duration statistics, the definition of elements, and the regularity of dispersion, using a bar graph is the best pick. You can enumerate all your main topics with a lengthy description on the horizontal axis and put the subcategory in the vertical axis. In this manner, you can create a clear picture in a summarized way of the subject that you wanted your audience to grasp.
Bar charts are made to simplify the comparison between sets of data and make it understandable to your audience. These bar diagrams can be the best aid in your presentations in the future.


